


This article is part of our MLB Barometer series.
A few times a year, I like to shake up the usual focus of this column and ditch the subjective viewpoint, handing the decision on who's a Riser and who's a Faller over to the RotoWire Earned Auction Value Calculator. The end of April makes for a fine time to do just that.
I like turning things over to the actual fantasy results every now and then as a reminder that for all that the underlying numbers deserve their focus due to their explanatory and often predictive power, and for all we learned not to trust stats like wins, ERA, batting average and RBI as measures of future fantasy value, it's the box score stats which actually win fantasy leagues. If we focus too much on skills alone, we'll lose focus on who's been able to capitalize on their skills the most by showing them off in a fantasy-relevant role.
Which players have actually helped or hurt fantasy teams the most so far, at least relative to their draft position? I've compared each player's rank in earned value so far to his average draft position in all NFBC drafts from March 1 through Opening Day. We'll go position group by position group, marking the players who have risen or fallen the most, though we'll begin with a group of risers from within the top-50 picks, as those moves are often the most significant even though it's hard to move too many spots within this range.
The boring technical bits:
A few times a year, I like to shake up the usual focus of this column and ditch the subjective viewpoint, handing the decision on who's a Riser and who's a Faller over to the RotoWire Earned Auction Value Calculator. The end of April makes for a fine time to do just that.
I like turning things over to the actual fantasy results every now and then as a reminder that for all that the underlying numbers deserve their focus due to their explanatory and often predictive power, and for all we learned not to trust stats like wins, ERA, batting average and RBI as measures of future fantasy value, it's the box score stats which actually win fantasy leagues. If we focus too much on skills alone, we'll lose focus on who's been able to capitalize on their skills the most by showing them off in a fantasy-relevant role.
Which players have actually helped or hurt fantasy teams the most so far, at least relative to their draft position? I've compared each player's rank in earned value so far to his average draft position in all NFBC drafts from March 1 through Opening Day. We'll go position group by position group, marking the players who have risen or fallen the most, though we'll begin with a group of risers from within the top-50 picks, as those moves are often the most significant even though it's hard to move too many spots within this range.
The boring technical bits: for the risers, I've ranked them by percent of possible spots gained (% Gain) rather than raw number of spots gained, because it's more impressive to jump from 50 to 5 than from 500 to 400. I've also excluded risers who remain outside the top-345, i.e. those who haven't been startable in 15-team mixed leagues. Similarly, I've excluded fallers who began outside the top-345, as those guys were drafted with reserve-round picks and are easily cut. I've also excluded fallers whose falls come as a result of them missing more than a week due to injury, as it's not very useful for me to tell you that it's bad when your players get hurt.
Risers
| Top 50 Picks | Team | Pos | March ADP Rank | Earned Value Rank | % Gain |
|---|---|---|---|---|---|
| Elly De La Cruz | CIN | 3B/SS | 20 | 1 | 100% |
| Gunnar Henderson | BAL | 3B/SS | 30 | 3 | 93.1% |
| Adolis Garcia | TEX | OF | 39 | 10 | 76.3% |
| CJ Abrams | WSH | SS | 34 | 11 | 69.7% |
| Mookie Betts | LAD | 2B/SS/OF | 4 | 2 | 66.7% |
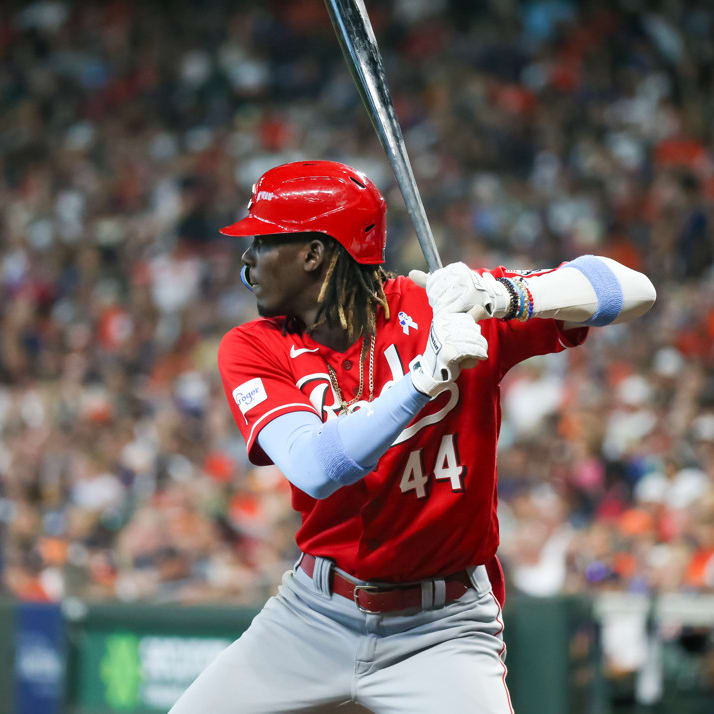
 Elly De La Cruz, 3B/SS, Reds: What were we worried about with this guy again? Fears that the Reds' crowded infield would eat into his playing time went away with Noelvi Marte's suspension and Matt McLain's shoulder surgery. Fears that he might strike out so much that he would play himself out of a regular role (or at the very least out of fantasy stardom) appeared accurate when he struck out 45.9 percent of the time over his first nine games, but since then, he's struck out just 23.5 percent of the time. His strikeout rate on the season still remains north of 30 percent, but he's very plainly able to have fantasy success despite that level of swing-and-miss, as he finished the first month as the best player in fantasy baseball. De La Cruz's legs deserve much of the credit for his first-place ranking, as his 18 steals lead the rest of the league by four (with just four other players in double digits) but his bat has been excellent as well. He's slashing .279/.385/.577 with eight homers (tied for fourth in the league) and a 17.9 percent barrel rate.
| Catchers | Team | March ADP Rank | Earned Value Rank | % Gain |
|---|---|---|---|---|
| Salvador Perez | KCR | 121 | 14 | 89.2% |
| William Contreras | MIL | 68 | 9 | 88.1% |
| Travis d'Arnaud | ATL | 408 | 107 | 74.0% |
| Ryan Jeffers | MIN | 241 | 69 | 71.7% |
| Ben Rortvedt | TBR | 1012 | 334 | 67.1% |
 Ryan Jeffers, C, Twins: Perez and Contreras are good catchers off to great starts, while d'Arnaud is a quality backup who spent most of April as a starter. Jeffers, on the other hand, has had the sort of April which could cause us to reassess his place within the catcher pool. He ended the month with five homers and a 168 wRC+, the product of a .295/.390/.545 slash line. What makes this potentially something more than just a hot month is that Jeffers struck out just 17.1 percent of the time, a huge step forward from his career 30.5 percent strikeout rate prior to this season. He did trade some quality of contact to get there, but while his 31.9 percent hard-hit rate is poor, his 8.3 percent barrel rate remains above-average. He still managed five homers, tied for fourth among all catchers, and if he can maintain the good power he's shown throughout his career while continuing the elevated amount of contact he showed this April, he'll be in for a career year. Jeffers is in his age-27 season and was trending in the right direction heading into this season, having posted a career-best .858 OPS in a career-high 35 plate appearances last year, so it's best to read this as a continuation of a trend rather than a hot month out of nowhere.
| Corner Infielders | Team | Pos | March ADP Rank | Earned Value Rank | % Gain |
|---|---|---|---|---|---|
| Elly De La Cruz | CIN | 3B/SS | 20 | 1 | 100.0% |
| Gunnar Henderson | BAL | 3B/SS | 30 | 3 | 93.1% |
| Alec Bohm | PHI | 1B/3B | 153 | 12 | 92.8% |
| Jordan Westburg | BAL | 2B/3B | 291 | 28 | 90.7% |
| Connor Joe | PIT | 1B/OF | 589 | 92 | 84.5% |
| Tyler Nevin | OAK | 3B/OF | 1206 | 199 | 83.6% |
| Josh Smith | TEX | 3B/SS/OF | 785 | 138 | 82.5% |
| Josh Naylor | CLE | 1B | 119 | 22 | 82.2% |
| Maikel Garcia | KCR | 3B | 190 | 37 | 81.0% |
| Luis Rengifo | LAA | 2B/3B/SS/OF | 230 | 46 | 80.3% |
 Jordan Westburg, 2B/3B, Orioles: Gunnar Henderson going from All-Star to MVP candidate in Baltimore is getting plenty of attention, but Westburg's April deserves plenty of love as well. The 25-year-old held his own in his 68-game debut last year, hitting .260/.311/.404 (good for a 97 wRC+) with a modest three homers and four steals. Through the end of April, he's already matched that steals total and set a new career high in homers (five) while hitting .301/.351/.515 (150 wRC+). More importantly, Westburg's underlying numbers are showing the growth needed to back this hot start up. He's making significantly more contact, cutting his strikeout rate from 24.6 percent to 17.6 percent. He's also making significantly louder contact, with his hard hit rate jumping from 44.5 percent to 55.6 percent and his barrel rate improving from 6.5 percent to 11.1 percent. Those improvements give Westburg a great chance to remain an everyday player even when Jackson Holliday forces his way back into the mix in the Orioles infield.
| Middle Infielders | Team | Pos | March ADP Rank | Earned Value Rank | % Gain |
|---|---|---|---|---|---|
| Elly De La Cruz | CIN | 3B/SS | 20 | 1 | 100.0% |
| Brice Turang | MIL | 2B/SS | 321 | 18 | 94.7% |
| Gunnar Henderson | BAL | 3B/SS | 30 | 3 | 93.1% |
| Jordan Westburg | BAL | 2B/3B | 291 | 28 | 90.7% |
| Josh Smith | TEX | 3B/SS/OF | 785 | 138 | 82.% |
| Wenceel Perez | DET | 2B/OF | 1186 | 230 | 80.7% |
| Luis Rengifo | LAA | 2B/3B/SS/OF | 230 | 46 | 80.3% |
| Blaze Alexander | ARI | SS | 707 | 140 | 80.3% |
| Jose Caballero | TBR | 2B/SS | 368 | 81 | 78,2% |
| Jake Cronenworth | SDP | 1B/2B | 308 | 87 | 72.0% |
 Brice Turang, 2B/SS, Brewers: Turang has always had great speed. He managed 26 steals as a rookie last year, a total which looks better considering that Turang's weak bat meant he didn't get on-base often (.285 on-base percentage) or play everyday (448 plate appearances). Through the first month of this year, he's already more than halfway to that stolen base total, and his 14 steals owe much to an increase in opportunities. He's improved his on-base percentage by 90 points, slashing .312/.375/.441, and while a .346 BABIP indicates he's been a bit fortunate, he's also made noticeable improvements. His chase rate has improved from the 57th to the 85th percentile, while his whiff rate has improved from the 71st to the 98th. Turang still isn't doing that much damage when he actually hits the ball, with a 2.5 percent barrel rate and 33.8 percent hard hit rate, but he's doing just about all he can for a hitter with his lack of pop. Turang was supposed to be a solid regular as a prospect, so this has the look of a player who made some adjustments after being overmatched as rookie and who should now settle in as a reliable everyday option, which should enable him to keep on running.
| Outfielders | Team | Pos | March ADP Rank | Earned Value Rank | % Gain |
|---|---|---|---|---|---|
| Jurickson Profar | SDP | OF | 616 | 45 | 92.8% |
| Jacob Young | WSH | OF | 770 | 60 | 92.3% |
| Taylor Ward | LAA | OF | 210 | 21 | 90.4% |
| Colton Cowser | BLA | OF | 382 | 43 | 89.0% |
| Jesse Winker | WSH | OF | 685 | 98 | 85.8% |
| Blake Perkins | MIL | OF | 1001 | 143 | 85.8% |
| Steven Kwan | CLE | OF | 201 | 30 | 85.5% |
| Jo Adell | LAA | OF | 568 | 86 | 85.0% |
| Connor Joe | PIT | 1B/OF | 589 | 92 | 84.5% |
| Tyler O'Neill | BOS | OF | 207 | 33 | 84.5% |
 Jacob Young, OF, Nationals: Young stole 13 bases in 33 games after his late-August debut last season, which you'd think would have generated more fantasy interest. He wasn't considered much of a prospect and didn't seem to have a path to an Opening Day roster spot, so anyone who did draft him probably dropped him when he failed to make the team out of camp. He was recalled just a week into the season with Victor Robles (hamstring) hitting the injured list, and he's made a great case to hold onto the job even once Robles returns. Through 76 plate appearances, Young is hitting .314/.351/.371 (good for a 109 wRC+) with 12 steals. Those stolen bases are what give him most of his fantasy value, but if it continues to run like this and hits just well enough to keep on playing consistently, that will work in a lot of roto leagues. That's where the questions come in, of course, and that's where we see why he wasn't a highly-touted prospect. His career slash line in the minors was a modest .274/.359/.360, with eight homers in 1,168 plate appearances. He has zero homers and zero barrels through his first 197 plate appearances, but if he keeps up the 14.5 percent strikeout rate he has so far this year, he'll keep getting to first base on a regular basis, giving him plenty of chances to steal.
| Starting Pitchers | Team | March ADP Rank | Earned Value Rank | % Gain |
|---|---|---|---|---|
| Ranger Suarez | PHI | 314 | 4 | 99.0% |
| Tanner Houck | BOS | 334 | 27 | 92.2% |
| Spencer Turnbull | PHI | 605 | 51 | 91.7% |
| Ronel Blanco | HOU | 539 | 61 | 88.8% |
| Jose Berrios | TOR | 156 | 24 | 85.2% |
| Cody Bradford | TEX | 604 | 97 | 84.1% |
| Mitchell Parker | WSH | 1206 | 225 | 81.4% |
| Shota Imanaga | CHC | 159 | 34 | 79.1% |
| Javier Assad | CHC | 506 | 113 | 77.8% |
| Bryce Miller | SEA | 170 | 40 | 76.9% |
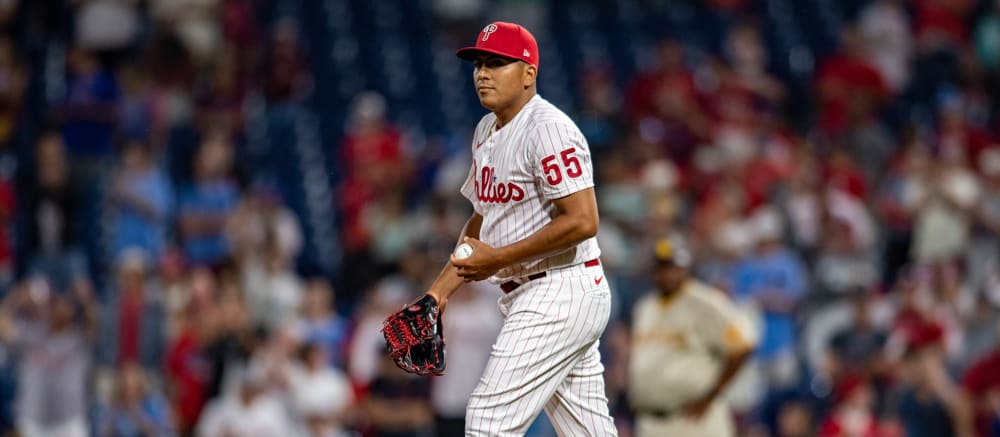
 Ranger Suarez, SP, Phillies: I ended up with Suarez on a lot of my teams this offseason, as I saw a pitcher who had historically produced roughly average strikeout (21.3 percent through 2023) and walk rates (8.4 percent) alongside a strong groundball rate (53.9 percent) and wondered why the rest of the fantasy market didn't value him more similarly to someone like Marcus Stroman who went 72 spots earlier in March NFBC drafts. I certainly wasn't expecting Suarez to finish April as the most valuable pitcher in fantasy baseball. I wouldn't expect him to finish May, let alone the season, as the most valuable pitcher in fantasy baseball, but his ranking isn't merely due to the fact that he's earned a league-leading five wins and is benefitting from good fortune in the form of a .189 BABIP. The lefty also has career highs in strikeout rate (27.8 percent), walk rate (3.5 percent) and groundball rate (60.8 percent). Both his xFIP (2.40) and SIERA (2.41) rank second among qualified starters. Suarez's success isn't linked to any added velocity or new pitch, which makes it easy to write off as largely just a hot streak, though it's also possible that his slight step back in velocity this year is leading to improved command and therefore better results.
| Relief Pitchers | Team | March ADP Rank | Earned Value Rank | % Gain |
|---|---|---|---|---|
| Reed Garrett | NYM | 1206 | 54 | 95.6% |
| Bryan Hudson | MIL | 1194 | 151 | 87.4% |
| Justin Slaten | BOS | 802 | 110 | 86.4% |
| Kirby Yates | TEX | 564 | 90 | 84.2% |
| Nick Sandlin | CLE | 1018 | 170 | 83.4% |
| Jason Foley | DET | 524 | 101 | 80.9% |
| Luke Weaver | NYY | 764 | 165 | 78.5% |
| Mitch Spence | OAK | 815 | 182 | 77.8% |
| Ryan Walker | SFG | 1043 | 246 | 76.5% |
| A.J. Minter | ATL | 456 | 108 | 76.5% |
 Reed Garrett, RP, Mets: Garrett returned fourth-round fantasy value through the first month of the season. That isn't going to continue unless Edwin Diaz suffers a long-term injury, as Garrett is still firmly no more than a setup man for the Mets, but his dominant April demands attention. The 31-year-old entered the season with just 44.1 MLB innings on his resume, spread between four organizations, and his 7.11 ERA, 1.96 WHIP and 32:28 K:BB could hardly make him look less like a future high-leverage weapon. But we need only remember as far back as last season to find Yennier Cano as an example of a pitcher who emerged out of nowhere at a similar stage in his career to become a late-inning weapon, so it's worth paying attention when Garrett does this in April: 15.2 IP, 0.57 ERA, 0.96 WHIP, 28:7 K:BB. That's a 45.9 percent strikeout rate, a mark which more than makes up for his 11.5 percent walk rate. Garrett's dominance comes not from elite velocity but from a kitchen sink approach, unusually for a reliever. He throws fastballs less than a quarter of the time, with over half of his pitchers being either a sweeper or a harder traditional slider, which sits around 90 mph. He's also improved his splitter and doubled its usage. Adding multiple trendy new pitches at once has led to a dominant first month, and there's little reason to think he'll suddenly revert to previous form. In any league where non-closing relievers are worth a roster spot, go get him.
Fallers
| Catchers | Team | March ADP Rank | Earned Value Rank | Spots Dropped |
|---|---|---|---|---|
| Henry Davis | PIT | 195 | 771 | 576 |
| Mitch Garver | SEA | 162 | 620 | 458 |
| Alejandro Kirk | TOR | 239 | 593 | 354 |
| Bo Naylor | CLE | 167 | 521 | 354 |
| Austin Wells | NYY | 309 | 598 | 289 |
 Mitch Garver, C, Mariners: There were certainly reasons to like Garver heading into the season. He was coming off a season in which he posted an .870 OPS, and it wasn't a fluke, as he'd hit .995 and .875 in that category earlier in his career. Health has been a problem for him for some time, and at age 33, there was little reason to bet on an improvement there, but a move to a designated hitter role in Seattle seemed promising. In theory, the role change should lead to more playing time than most catcher-eligible players as well as a better chance at staying healthy. Thus far, Garver is indeed playing consistently, though his 98 plate appearances merely rank 15th among players who qualify at catcher. As for improved health, Garver hasn't hit the injured list yet, but he did miss time with back spasms as early as the second game of the season. It's possible nagging back issues are partly to blame for his performance, as he's seen his strikeout rate spike to 31.6 percent while slashing just .143/.255/.298. His 37.0 percent hard-hit rate is also a career low, and his .160 xBA and .297 xSLG indicate he's earned pretty much every bit of his struggles so far.
| Corner Infielders | Team | Pos | March ADP Rank | Earned Value Rank | Spots Dropped |
|---|---|---|---|---|---|
| Jose Abreu | HOU | 1B | 293 | 944 | 651 |
| Colt Keith | DET | 2B/3B | 265 | 812 | 547 |
| Ezequiel Duran | TEX | 3B/SS/OF | 315 | 822 | 507 |
| Brandon Drury | LAA | 1B/2B | 203 | 707 | 604 |
| Andrew Vaughn | CWS | 1B | 232 | 714 | 482 |
| Alex Bregman | HOU | 3B | 78 | 497 | 419 |
| Spencer Torkelson | DET | 1B | 110 | 449 | 339 |
| Yandy Diaz | TBR | 1B | 123 | 418 | 295 |
| Vladimir Guerrero | TOR | 1B | 29 | 304 | 275 |
| Rafael Devers | BOS | 3B | 21 | 290 | 269 |
 Jose Abreu, 1B, Astros: It takes a lot for a player with two years and nearly $40 million left on his contract to be demoted before the end of April. Abreu had the right to refuse such a demotion, so credit to him for accepting it as he works to overcome his horrendous start to the year. In 77 trips to the plate, Abreu managed zero homers while slashing just .099/.156/.113. For reference, pitchers collectively hit .108/.147/.137 in the 2021 season. Abreu's 23.4 percent strikeout rate is a career high, but it's not a problem on its own. He's walking just 3.9 percent of the time and is making very weak contact, recording a 27.8 percent hard-hit rate and a 0.0 percent barrel rate. He's also pounding the ball into the ground a career-high 51.9 percent of the time. You can look at the player who had an .860 OPS over the first nine years of his career and argue that Abreu has to pull himself out of this eventually and return as at least a slightly above-average hitter, but you can also look at his .680 OPS from last season and his age (37) and argue that his days as an MLB regular are over.
| Middle Infielders | Team | Pos | March ADP Rank | Earned Value Rank | Spots Dropped |
|---|---|---|---|---|---|
| Jackson Holliday | BAL | 2B/SS | 179 | 918 | 739 |
| Colt Keith | DET | 2B/3B | 265 | 812 | 547 |
| Ezequiel Duran | TEX | 3B/SS/OF | 315 | 822 | 507 |
| Brandon Drury | LAA | 1B/2B | 203 | 707 | 604 |
| Corey Seager | TEX | SS | 28 | 372 | 344 |
| Gleyber Torres | NYY | 2B | 69 | 399 | 330 |
| Gavin Lux | LAD | 2B | 275 | 604 | 329 |
| Whit Merrifield | PHI | 2B/OF | 267 | 580 | 313 |
| Bo Bichette | TOR | SS | 33 | 328 | 295 |
| Carlos Correa | MIN | SS | 231 | 506 | 275 |
 Bo Bichette, SS, Blue Jays: There's one unequivocal positive to Bichette's stat line, which is that he's already attempted four steals (with three successes), putting him halfway to last year's total of eight just one month into the year. If Bichette keeps running and gets his bat back on track, he could still wind up meeting or exceeding his draft-day price. But getting that bat on track could take some doing. He's making more contact that ever, with his 14.8 percent strikeout rate beating his previous career low of 19.1 percent from last year, but that contact is worse than ever in multiple ways. Both his 38.9 percent hard-hit rate and 2.1 percent barrel rate are comfortably career lows, with the latter mark looking out of character for a hitter who's consistently north of 9.5 percent in that category. Compounding the problem of weak contact is the fact that Bichette's 51.6 percent groundball rate is a career high. The result of all this has been a .205/.262/.295 slash line and just one home run, a far cry from the elite four-category compiler Bichette was supposed to be.
| Outfielders | Team | Pos | March ADP Rank | Earned Value Rank | Spots Dropped |
|---|---|---|---|---|---|
| Jordan Walker | STL | OF | 109 | 852 | 743 |
| Victor Scott | STL | OF | 333 | 893 | 560 |
| Ezequiel Duran | TEX | 3B/SS/OF | 315 | 822 | 507 |
| Matt Wallner | MIN | OF | 329 | 794 | 465 |
| Nolan Jones | COL | OF | 52 | 517 | 465 |
| Parker Meadows | DET | OF | 243 | 650 | 407 |
| Nick Castellanos | PHI | OF | 94 | 496 | 402 |
| Randy Arozarena | TBR | OF | 40 | 394 | 354 |
| James Outman | LAD | OF | 175 | 525 | 350 |
| Whit Merrifield | PHI | 2B/OF | 267 | 580 | 313 |
 Parker Meadows, OF, Tigers: Three of the first four outfielders on this list have already been demoted. If Meadows joins them soon, it will be hard to call it undeserved. The 24-year-old was a popular sleeper pick this winter as a defense-first outfielder whose glove should help him play often enough to post decent power and speed numbers despite an overall questionable bat. So far, that bat has been far worse than merely questionable, as he finished April with a .100/.222/.229 slash line, with his .116 xBA indicating that he can't blame bad luck for much of his struggles. Meadows had a slightly elevated strikeout rate last season (25.5 percent), but that mark has shot up to an untenable 37.0 percent this year. He's still managed a 10.0 percent barrel rate when he does happen to make contact, leading to a pair of homers, but he's going to have to cut his strikeout rate significantly for the rest of the profile to work out. He isn't chasing pitches at an elevated rate, but the fact that his whiff rate sits in the 14th percentile even as he picks reasonable pitches to swing at is cause for concern.
| Starting Pitchers | Team | March ADP Rank | Earned Value Rank | Spots Dropped |
|---|---|---|---|---|
| Joe Musgrove | SDP | 99 | 932 | 833 |
| Jesus Luzardo | MIA | 79 | 912 | 833 |
| Hunter Brown | HOU | 157 | 979 | 822 |
| Chris Bassitt | TOR | 125 | 905 | 780 |
| Griffin Canning | LAA | 262 | 964 | 702 |
| Kenta Maeda | DET | 234 | 880 | 646 |
| Chris Paddack | MIN | 301 | 843 | 542 |
| Kevin Gausman | TOR | 41 | 570 | 529 |
| Triston McKenzie | CLE | 202 | 686 | 484 |
| Trevor Rogers | MIA | 299 | 753 | 454 |
Hunter Brown, SP, Astros: Brown had all the key ingredients of a pitcher sleeper this past winter. He was young (25), wasn't far removed from being a top prospect, and had ERA estimators (3.74 SIERA) which far outpaced his disappointing 5.09 ERA last year. What's not to like about a young pitcher who combined a league-average walk rate (8.3 percent) with a strong strikeout rate (26.8 percent) and groundball rate (52.4 percent)? Through six starts this season, the hype looks very much misplaced. Brown's ERA has spiked all the way to 9.78, and while it's taken a .444 BABIP and a 56.8 percent strand rate to get him to that elevated mark, his 4.50 SIERA indicates that he's taken a step back rather than a step forward. His strikeouts are down (20.9 percent), his walks are up (12.2 percent) and his groundball are down (48.1 percent). There's nothing to point to here if you're hoping for an immediate turnaround, so Brown should be left on the bench for the foreseeable future in leagues deep enough that he hasn't already been cut.
| Relief Pitchers | Team | March ADP Rank | Earned Value Rank | Spots Dropped |
|---|---|---|---|---|
| Will Smith | KCR | 72 | 966 | 894 |
| David Bednar | PIT | 95 | 664 | 569 |
| Ryan Pressly | HOU | 331 | 860 | 529 |
| Josh Hader | HOU | 53 | 555 | 502 |
| Jose Leclerc | TEX | 206 | 589 | 383 |
| Tanner Scott | MIA | 136 | 401 | 265 |
| Edwin Diaz | NYM | 46 | 297 | 251 |
| Adbert Alzolay | CHC | 152 | 395 | 243 |
| Carlos Estevez | LAA | 218 | 455 | 237 |
| Alex Lange | DET | 204 | 437 | 233 |
 Tanner Scott, RP, Marlins: Unlike a lot of the pitchers on this list, Scott seemingly hasn't lost his closer role. His four saves represented all the Marlins would manage in April, though he did pitch in the eighth inning Wednesday with Anthony Maldonado pitching a clean ninth with a three-run lead, indicating a potential changing of the guard. Given the way Scott's season has gone so far, it would hardly be a shock if the Marlins' bullpen depth chart changes soon. Scott may have a 2.77 ERA on the year, but his ERA estimators (5.91 xFIP, 6.16 SIERA) tell a very different story. The lefty has always struggled with command, but his 22.2 percent walk rate thus far is well beyond tolerable. (The highest walk rate among pitchers who threw at least 50 innings last season was 15.6 percent.) The steady stream of walks could be more tolerable if Scott was running a strikeout rate north of 30 percent as usual, but he's all the way down to 19.0 percent this season. Given Scott's history of streakiness, it would hardly be a shock for him to start pitching like the best version of himself at some point this season and looking like an excellent closer, but at the moment, it's easier to envision him pitching his way out of the ninth inning.