


My friend Ian Kahn has stated multiple times that players joining the Yankees initially struggle upon joining the team. The reason he believes this is true is the added stress from the unrelenting media and fans. I love digging into a good narrative as much as the next person, so I decided to see if there was any truth to his theory.
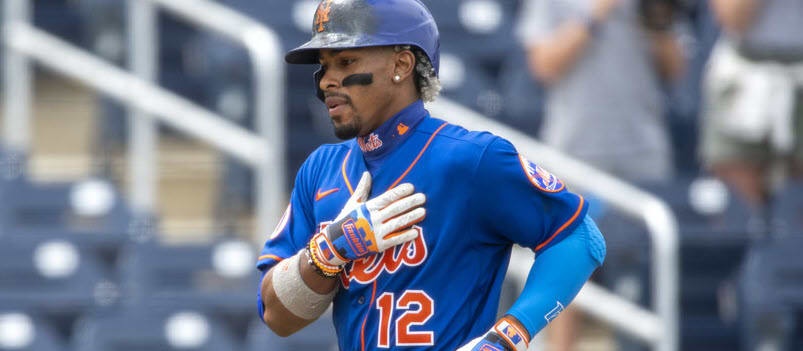
I would normally just blow off most narratives, but the big, bad New York City narrative kept getting brought up with the struggles of Francisco Lindor (.734 OPS) and Joey Gallo (.707 OPS) this past season. Both players were added to help their new team, and both disappointed. I needed to get an answer one way or another.
Setup
The study was relatively simple. I looked at all hitters from 2010 to 2021 who played for a team the previous season and then a new team the next season. I limited the study to those with 200 PA, so only "regulars" were examined. I found the median, average and weighted average of the OPS difference between their Steamer projections and the actual results. I used Steamer projections because they take park and league factors into account while applying an aging curve.
Most of these players were around 30 years old. It's not the youngest crowd.
Here are the results. The table is sorted by average of the three differences:
| Team | Count | Age | Avg | Median | Weighted Average | Avg of three |
|---|---|---|---|---|---|---|
| White Sox | 11 | 29.5 | -0.048 | -0.031 | -0.067 | -0.048 |
| Yankees |
My friend Ian Kahn has stated multiple times that players joining the Yankees initially struggle upon joining the team. The reason he believes this is true is the added stress from the unrelenting media and fans. I love digging into a good narrative as much as the next person, so I decided to see if there was any truth to his theory.
I would normally just blow off most narratives, but the big, bad New York City narrative kept getting brought up with the struggles of Francisco Lindor (.734 OPS) and Joey Gallo (.707 OPS) this past season. Both players were added to help their new team, and both disappointed. I needed to get an answer one way or another.
Setup
The study was relatively simple. I looked at all hitters from 2010 to 2021 who played for a team the previous season and then a new team the next season. I limited the study to those with 200 PA, so only "regulars" were examined. I found the median, average and weighted average of the OPS difference between their Steamer projections and the actual results. I used Steamer projections because they take park and league factors into account while applying an aging curve.
Most of these players were around 30 years old. It's not the youngest crowd.
Here are the results. The table is sorted by average of the three differences:
| Team | Count | Age | Avg | Median | Weighted Average | Avg of three |
|---|---|---|---|---|---|---|
| White Sox | 11 | 29.5 | -0.048 | -0.031 | -0.067 | -0.048 |
| Yankees | 23 | 32.3 | -0.028 | -0.054 | -0.037 | -0.04 |
| Royals | 12 | 30 | -0.022 | -0.039 | -0.024 | -0.028 |
| Angels | 15 | 30.3 | -0.036 | -0.007 | -0.04 | -0.028 |
| Athletics | 26 | 29.8 | -0.02 | -0.036 | -0.017 | -0.024 |
| Guardians | 21 | 31.7 | -0.015 | -0.033 | -0.016 | -0.021 |
| Marlins | 18 | 31.6 | -0.016 | -0.027 | -0.011 | -0.018 |
| Rockies | 13 | 31.5 | -0.014 | -0.009 | -0.017 | -0.013 |
| Red Sox | 17 | 30.2 | -0.014 | 0.001 | -0.015 | -0.009 |
| Mets | 20 | 31.7 | -0.005 | -0.012 | -0.004 | -0.007 |
| Nationals | 17 | 31.3 | 0 | -0.01 | -0.002 | -0.004 |
| Padres | 22 | 28.8 | -0.001 | -0.001 | -0.008 | -0.003 |
| Blue Jays | 22 | 29.6 | 0.001 | 0 | -0.005 | -0.001 |
| Giants | 21 | 31.6 | -0.002 | -0.002 | 0.001 | -0.001 |
| Twins | 12 | 31.8 | 0.003 | -0.003 | 0.007 | 0.002 |
| Rangers | 13 | 32.4 | 0.011 | -0.016 | 0.015 | 0.003 |
| Cardinals | 14 | 31.3 | 0.001 | 0.007 | 0.006 | 0.005 |
| Pirates | 10 | 31.7 | 0.01 | 0.006 | 0.002 | 0.006 |
| Mariners | 27 | 30.3 | 0.011 | -0.003 | 0.012 | 0.006 |
| Rays | 27 | 29.9 | 0.008 | 0.015 | 0.008 | 0.01 |
| Phillies | 11 | 30.5 | 0.011 | 0.021 | 0.001 | 0.011 |
| Orioles | 18 | 29.4 | 0.015 | 0.025 | 0.013 | 0.018 |
| Cubs | 14 | 30.6 | 0.027 | 0.029 | 0.002 | 0.019 |
| Diamondbacks | 22 | 30.5 | 0.011 | 0.031 | 0.021 | 0.021 |
| Dodgers | 20 | 32.2 | 0.024 | 0.03 | 0.019 | 0.024 |
| Brewers | 19 | 30.2 | 0.014 | 0.032 | 0.027 | 0.024 |
| Astros | 18 | 29.5 | 0.024 | 0.033 | 0.021 | 0.026 |
| Tigers | 15 | 29.9 | 0.036 | 0.037 | 0.024 | 0.032 |
| Reds | 13 | 30.5 | 0.022 | 0.045 | 0.037 | 0.034 |
| Braves | 18 | 30.5 | 0.05 | 0.052 | 0.023 | 0.042 |
Ian was right in that players who join the Yankees underperform their projections by about 40 points of OPS. The Yankees came in second behind the White Sox who seem to suck the soul out of the hitters they sign. I asked around and no one had a good reason for the struggles with the White Sox.
On the opposite end of the spectrum, the Braves, Reds, Tigers and Astros had the players they added outperform their projections.
The deal is that it's almost impossible to know for sure why any of the players out or underperformed their projections. I feel… off even making these calls based on, in some cases, just 10 players over the 10 years. The samples are small and cover a time frame where different coaches and general managers have come and gone.
I ran three tests with the data to provide some insight. The first two are simple. The first was a correlation of the player's age to the average miss by the projections:
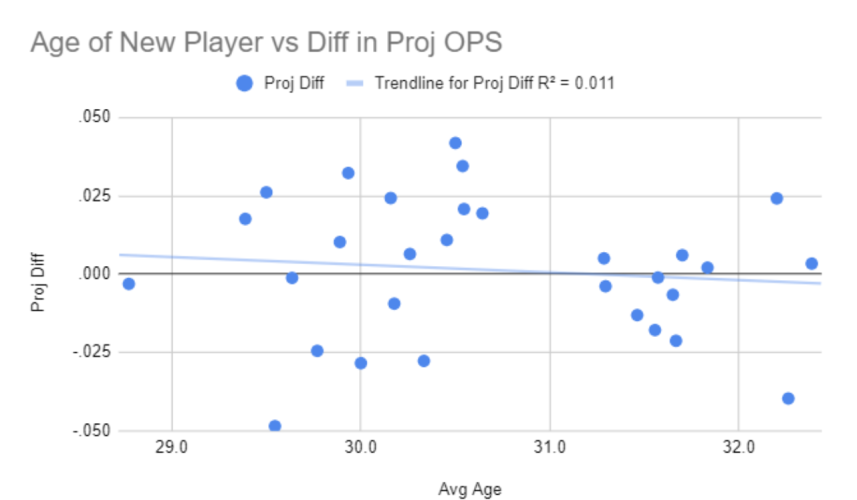
While the best fit line has a slope, it doesn't matter with an r-squared of 0.01.
For the next test, I used the city's population as a distraction measurement and here is that graph:
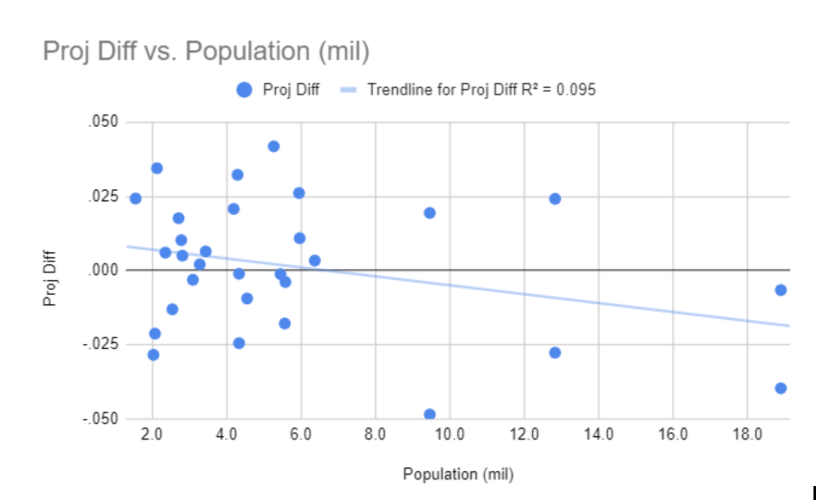
There is a little bit more correlation here, but nothing I'd hang my hat on. I'm sure someone will latch onto it and jump to more definite conclusions.
For the final study, I unknowingly recreated the bell shaped distribution curve. First, I found the standard deviation (SD) of every player that ended up at .106 OPS. This should say a lot about the finding. On average, hitters miss their projection by at least 100 points of OPS.
The next step was to find how much variation should be expected since multiple players are compared and variation should eventually migrate to zero. I used the Central Limit Theorem to find the expected overall distribution (example) given the number of players each team signed.
(Std Dev on Indiv Samples)/(sqrt(# of samples))=Final Value Standard Deviation
Here are the values:
| Team | Avg Diff | Group Std Dev | Total Deviations |
|---|---|---|---|
| Braves | 0.042 | 0.025 | 2.6 |
| White Sox | -0.048 | 0.032 | 1.9 |
| Tigers | 0.032 | 0.027 | 1.7 |
| Angels | -0.028 | 0.027 | 1.7 |
| Yankees | -0.04 | 0.022 | 1.6 |
| Dodgers | 0.024 | 0.024 | 1.3 |
| Cubs | 0.019 | 0.028 | 1.2 |
| Astros | 0.026 | 0.025 | 1.2 |
| Athletics | -0.024 | 0.021 | 1.2 |
| Reds | 0.034 | 0.029 | 1 |
| Royals | -0.028 | 0.031 | 0.9 |
| Marlins | -0.018 | 0.025 | 0.8 |
| Cleveland | -0.021 | 0.023 | 0.8 |
| Orioles | 0.018 | 0.025 | 0.8 |
| Brewers | 0.024 | 0.024 | 0.7 |
| Red Sox | -0.009 | 0.026 | 0.7 |
| Mariners | 0.006 | 0.02 | 0.7 |
| Diamondbacks | 0.021 | 0.023 | 0.6 |
| Rockies | -0.013 | 0.029 | 0.6 |
| Rays | 0.01 | 0.02 | 0.5 |
| Rangers | 0.003 | 0.029 | 0.5 |
| Phillies | 0.011 | 0.032 | 0.4 |
| Pirates | 0.006 | 0.034 | 0.4 |
| Mets | -0.007 | 0.024 | 0.2 |
| Twins | 0.002 | 0.031 | 0.1 |
| Giants | -0.001 | 0.023 | 0.1 |
| Cardinals | 0.005 | 0.028 | 0.1 |
| Blue Jays | -0.001 | 0.023 | 0.1 |
| Padres | -0.003 | 0.023 | 0 |
| Nationals | -0.004 | 0.026 | 0 |
The expected standard deviation outcomes (4th column) line up with 66% within 1 SD (68% expected), 97% within 2 SD (95% expected) and one team (Atlanta) greater than 2 SD.
Basically the final results are what would be expected given a normal distribution of outcomes and the results point to random chance being the reason players signed by the Yankees have struggled.
Conclusion
It seems like there is a minuscule drop in a hitter's production playing in a major city. There is no way to know 100% that "pressure" is the cause. I'm sure someone wants to believe their own narrative on the struggles, but I'll pass. Most likely, the small-sample variation is just random noise. It's not the sexiest answer, but the most likely one.